
Based on aggregated data from the parks managed with Experticket, we have analyzed some of the key indicators for the 2026 season: the length of the operating season, sales trends, demand concentration, and changes in the average ticket price.
The results show a longer season and an increase in the average transaction value—two variables that are particularly relevant for the commercial and operational planning of these types of venues.
Note: The data included corresponds to aggregated average values for all the parks analyzed by Experticket and should be interpreted as an industry benchmark, not as a statistical representation of the entire market.
One of the most notable changes is in the operating schedule.
The average season length has increased from 98 days in 2025 to 109 days in 2026, representing 11 additional days of operation.
This increase has implications that go beyond simply having more operating days. A longer season also means more opportunities to generate revenue, spread out demand, and optimize the use of the park’s resources.
For operators, this makes it even more important to have tools capable of adapting schedules, availability, prices, and distribution channels to demand that does not behave the same way throughout the entire season.
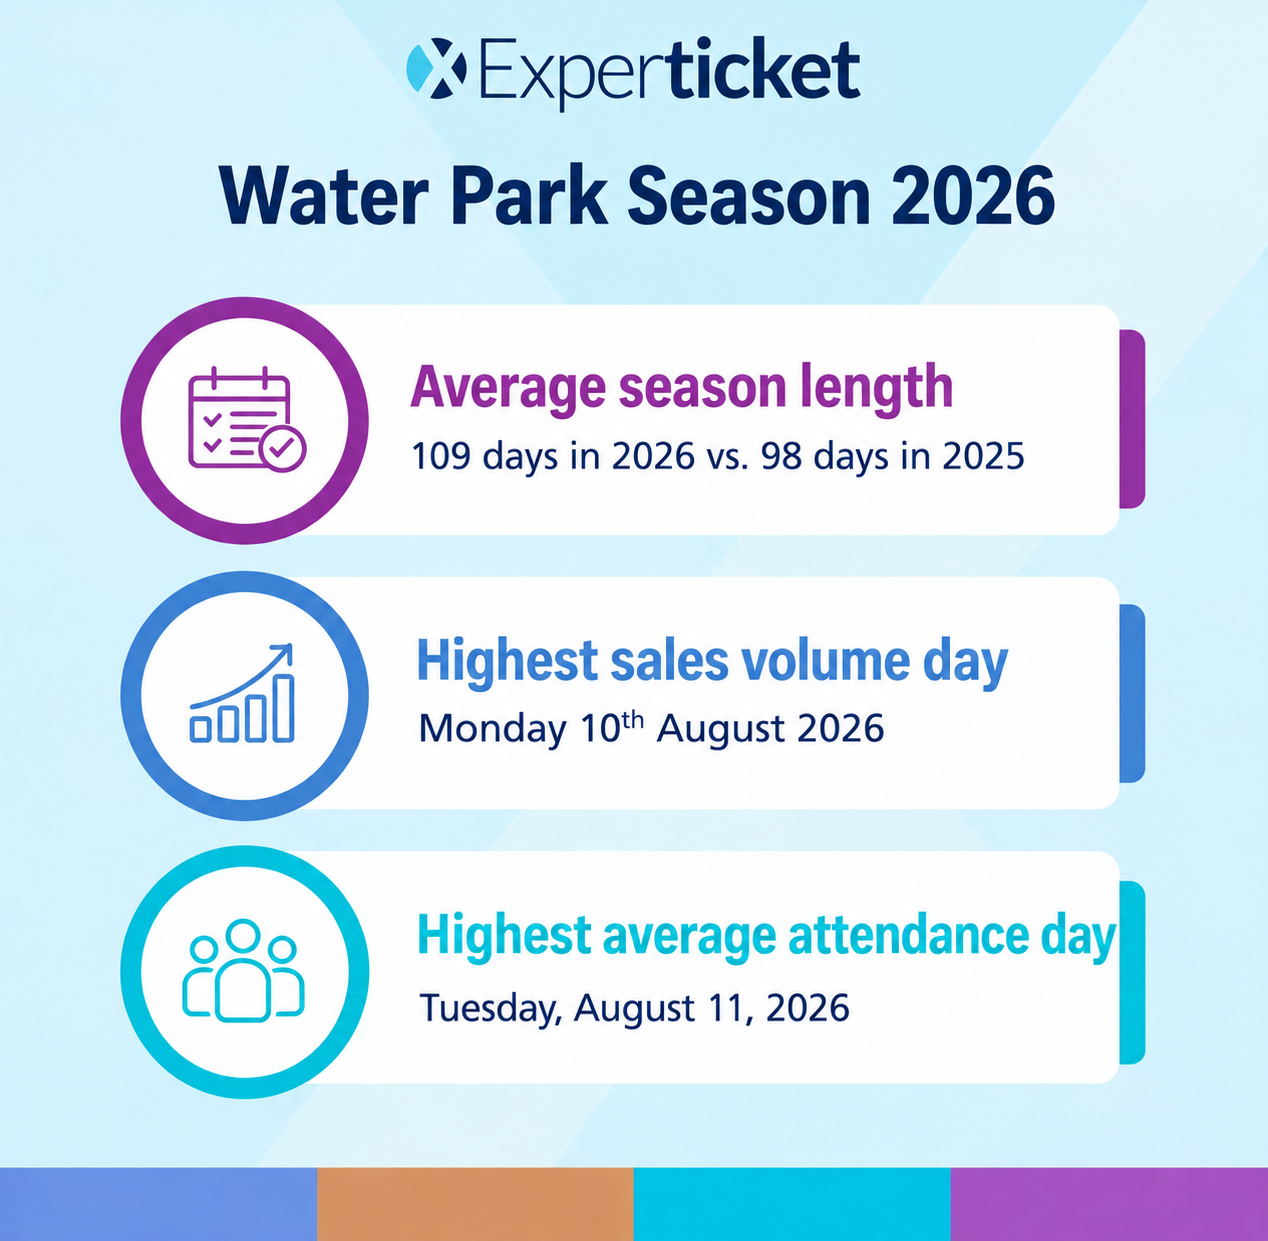
This figure represents an approximate 11.2% increase in the average season length compared to the previous year.
The concentration of demand remains one of the key factors in the management of water parks.
In 2026, the day with the highest sales volume was Monday, August 10.
Meanwhile, Tuesday, August 11, was the day with the highest average attendance.
The proximity of these two dates is particularly noteworthy: the highest sales volume and the highest attendance were concentrated on consecutive days during the summer’s peak demand period.
For an operator, anticipating these peaks is essential—not only to maximize sales but also to manage capacity, access, staffing, food and beverage services, additional amenities, and the visitor experience.
The ability to work with up-to-date information allows for a shift from management based exclusively on historical forecasts to more dynamic operational planning.
The second major indicator analyzed is the average transaction value.
In 2026, the average ticket stands at €84.51, compared to €81.11 recorded in 2025.
This represents a 4.19% increase .
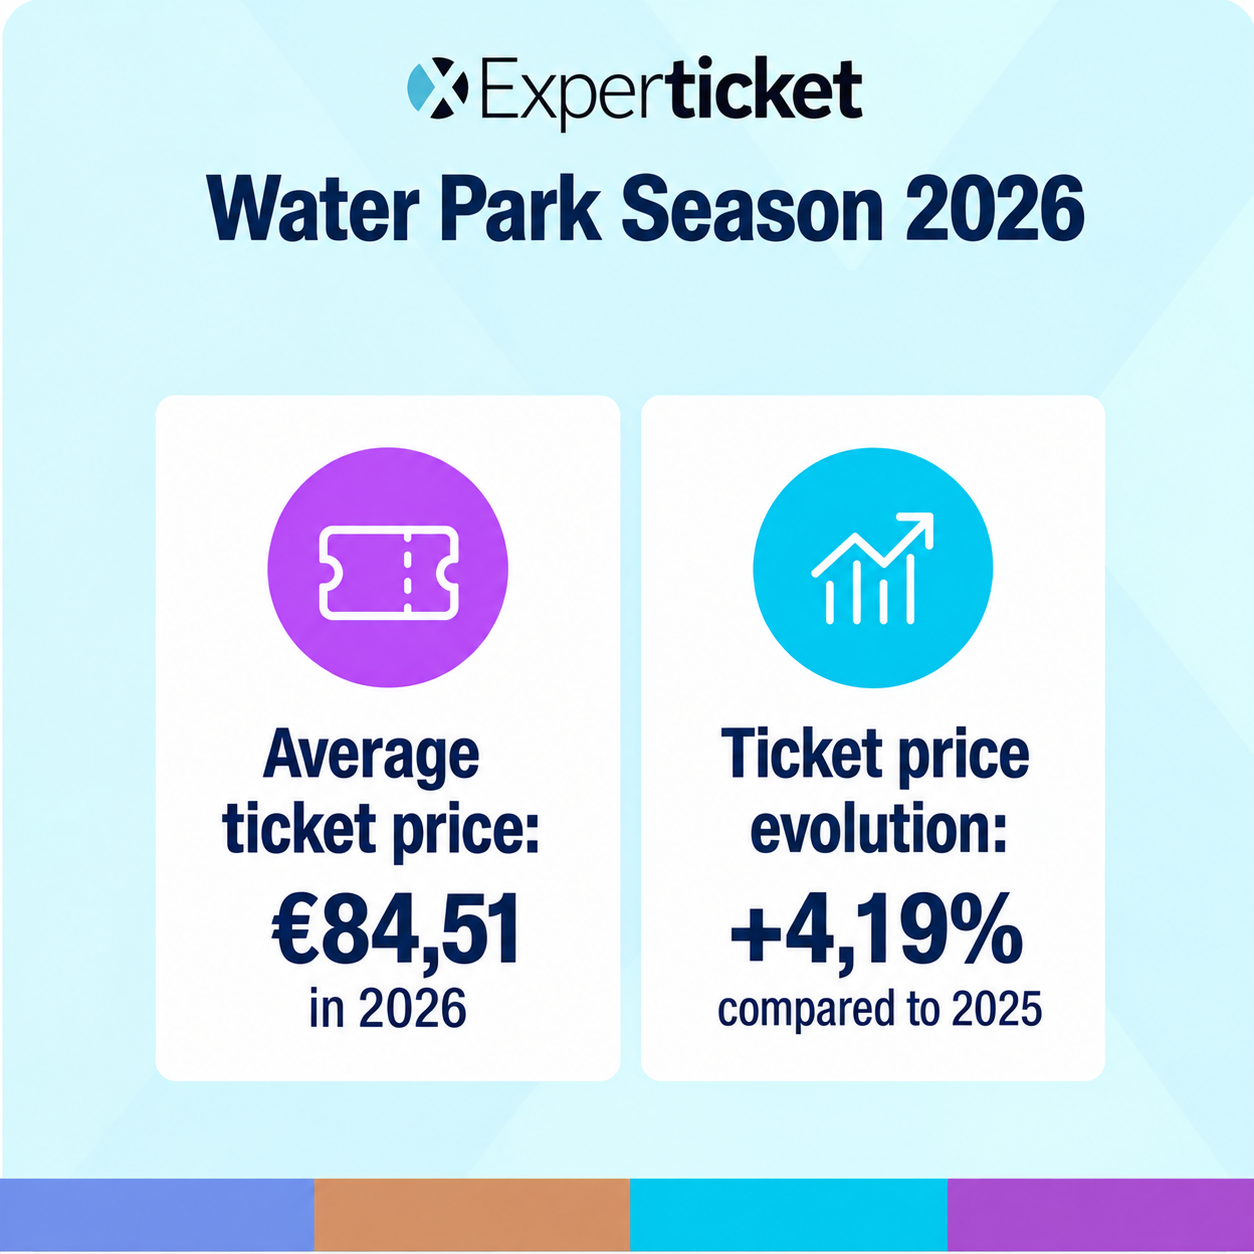
This data is significant because it shows that the growth in value generated per transaction does not depend solely on an increase in the number of visitors.
Changes in the average ticket price may be related to various factors: pricing structure, the mix of products purchased, advance sales, additional services, or a combination of tickets and other products.
Therefore, analyzing only the ticket price may provide an incomplete picture of a park’s commercial performance.
The 2026 data reveal two simultaneous trends: a longer average season and a higher average transaction value.
For sales and operations teams, both variables are linked to a broader question: how to best capitalize on every sales opportunity throughout the season.
In an environment with multiple channels, distributors, and products, inventory and availability management take on a strategic role. The goal is not merely to sell more tickets, but to make each product available to the right visitor, through the right channel, at the right time.
This requires the ticketing system to work seamlessly with the business strategy and the rest of the park’s technology ecosystem.
The evolution of the industry also underscores the importance of multichannel distribution.
Water parks do not rely solely on their direct sales channel. The combination of online sales, box office, travel distributors, OTAs, agencies, B2B partners, and other digital channels allows them to expand their commercial reach and diversify their sources of demand.
The challenge lies in managing all these channels without creating additional operational complexity.
A ticketing platform must enable the centralization of inventory, availability, pricing, and sales, while keeping information synchronized across the various distribution channels.
In this context, connectivity is no longer just a technological issue; it has a direct impact on commercial capacity, operational efficiency, and business control.
Data becomes more valuable when analyzed in context.
In the 2025 report, we analyzed these indicators for the first time and observed an average season length of 98 days and an average ticket price of €81.11.
In 2026, both indicators have changed:
| Indicator | 2025 | 2026 | Change |
|---|---|---|---|
| Average season length | 98 days | 109 days | +11 days |
| Average ticket price | €81.11 | €84.51 | +4.19% |
| Day with the highest sales volume | August 6 | August 10 | |
| Day with the highest average foot traffic | August 11 | August 11 |
You can view the full analysis of the previous season and compare both reports in our article on the 2025 season: 2025 Water Park Season: Experticket Analyzes Key Summer Figures
Seasonal indicators aren’t just for analyzing what happened. They also provide a foundation for making better decisions for the next season.
Changes in the calendar, demand patterns, and average ticket price trends can help operators review pricing, products, capacity, distribution, and operational planning.
In a sector as seasonal as the water park industry, having structured information linked to the ticketing system allows operators to turn each season’s data into insights for the next.
At Experticket, we continue to analyze industry trends based on the data generated by our platform, with the goal of identifying trends that can help leisure operators improve their business and operational decisions.